EAF - Graftech - well positioned
Graftech manufactures and sells graphite electrodes. Graphite electrodes are the main heating element used in an electric arc furnace, a steelmaking process where scrap from old cars or appliances is melted to produce new steel.
Needle coke is the main raw material used in electrodes that producers say can take up to six months to make with processes including baking and breaking to convert the coke into graphite. Graftech owns both in-house and has integrated (vertically) them into their processes.
Graftechs ticker symbol is EAF (Electric Arc Furnaces) and is traded on the New York Stock Exchange
The 52-week high was $13.04 and the 52-week low $5.56, and the current stock price is at $12.72, very close to the 52-week high! The entry point might not be perfect now! ❌
The 1-year performance is +60% and -18% since its IPO in 2018! The long-term chart gives us more information
It is clear that Graftech is in a downward trend since July-August of 2019, there seems to be a bottom at around $6! The 1-year chart below shows an upward trend since November 2020, and the stock is now bouncing between $11-$13, and when it breaks that resistance level, it can continue to $15 (Look at the long term chart above, where the stock is bouncing back from the ~$15 level)!
Who are the main owners of the company
The biggest owner (55%) is Brookfield Assets Management which did the IPO placement 2018 as well, but you see star funds here too, such as Vanguard, Blackrock, you even see a "GMO Climate Change Fund" owning this stock, due to its position to supply steel recyclers with graphite electrodes! We like high stake owners and star funds, as they do extremely well research on a company ✅
Then always the Balance Sheet first
The total assets have increased since 2017 but stayed the same the last 3 years. The cash reserves have doubled the last year. Net PPE (Property Plant Equipment) has remained the same, which gives me a sign that no big additional investments were needed or required to drive their business. A smaller intangible $243m corresponds to ~17% of the total assets, the biggest part is Net PPE of roughly 30%
To start of 1) the long-term debt has decreased a lot the last 3 years, $600million, 2) equity, even though still negative, is increasing $700m at the same time and 3) the net debt is even performing better, improvement with $900m ❌
[Every time you have such a big debt portion, you want to look into that. Graftech has a 2018 Credit Loan Agreement with JP Morgan (due in February 2025), which was reduced by $1billion from the previous year, half of that payment came from a 2020 Senior Note (due date is December 2028) of $500million. Senior Notes are normally better, as they cannot be called before the due date and are secured by assets, even though they carry a slightly higher interest expense! ]
A second calming point is that Brookfield Asset Management is the main shareholder and put that amount of debt on Graftech in the IPO - if there were any problems, they would be able to act accordingly to keep the company running its business
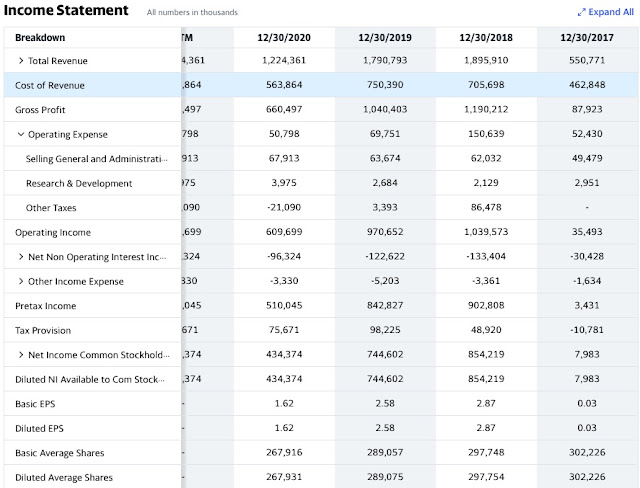
The revenue is down for 2020, explainable by the downturn in the economy. The gross margin for 2020 was ~50%, down from 58% in the year before. The EBIT margin is impressive but not as good as a normal year, e.g. 2019! The Net Income is half of that 2 years ago, but it might be a promising outlook where we can bounce back to! The number of shares has decreased by ~30 million in the last 2 years! ✅
In this analysis, we look at the cash flows too
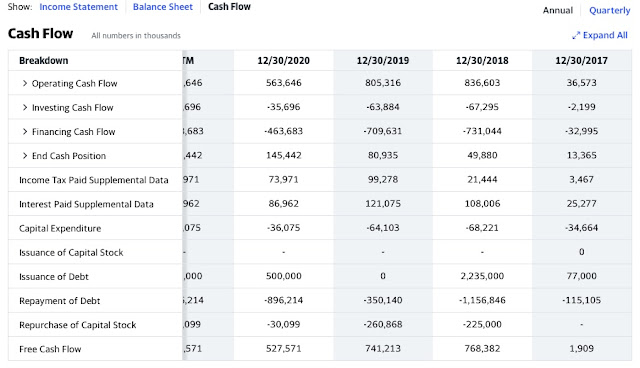
The Free Cash Flow is amazing, due to high Income/Operating Cash Flows and low reinvestment needs. When the debt is repaid in 3 years, this company will generate cash piles after cash piles! With a trailing PE of 7 (compared to the trailing PE of the sector (electrical equipment) 105!!!) is really really cheap, even if I would compare it to a steel company, the average trailing PE there is 35! ✅
If we now play with the scenario that 1) the earnings will come back to pre-pandemic times and 2) the PE will return back to the average, this could become a 10x Bagger!


Comments
Post a Comment